
Indianapolis Real Estate Market: How Buyers and Sellers Can Read the Data
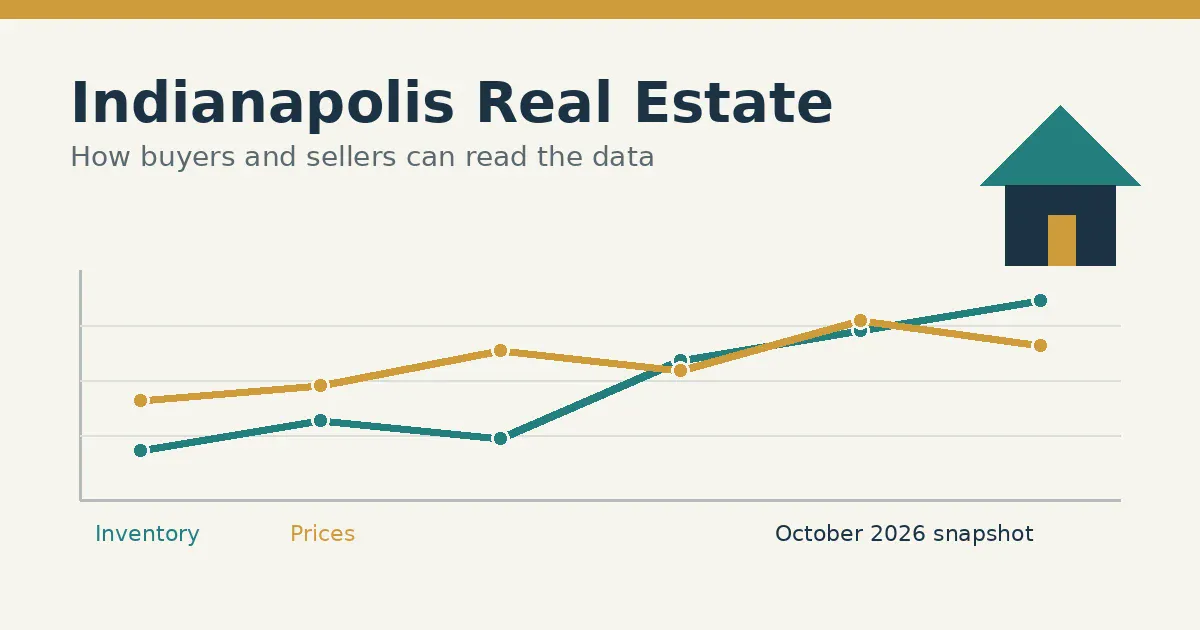
If you are watching the Indianapolis real estate market, a single headline rarely tells the whole story. Inventory, pricing, days on market, pending contracts, and seasonality each describe a different part of the market. The most useful question is not simply whether the market is “up” or “down,” but what the data means for your specific home, budget, timing, and neighborhood.
Talk with an Indianapolis real estate agent about your market questions
Indianapolis market snapshot: October 2026
The latest available monthly report from the Indiana Association of REALTORS®’ MLS Data Warehouse, published November 7, 2026, covers the MIBOR Association area. That area includes 14 counties, including Marion, Hamilton, Hendricks, Johnson, Hancock, and Madison counties, so it is best read as a Central Indiana metro-area indicator rather than a statistic for every Indianapolis neighborhood.
| Measure | October 2026 result | Year-over-year context |
|---|---|---|
| Average daily inventory | 8,187 homes | Up 17% |
| New listings | 3,411 | Down 4% |
| Closed sales | 2,392 | Down 15% |
| Median days from listing to pending | 32 days | Up 23% |
| Months of inventory | 3.1 months | Up 17% |
| Median sale price | $310,000 | Flat year over year |
Source and date for every figure in the table: MIBOR Association Monthly Market Report for October 2026, last updated November 7, 2026. MIBOR notes that inventory is an average of active listings at the start of each day, while days on market measures time from listing to pending.
1. Inventory shows how much choice buyers have
Inventory is the number of homes available for purchase at a given time. In the October 2026 MIBOR report, average daily inventory was 8,187 homes, 17% higher than a year earlier. Months of inventory was 3.1, also up 17% year over year. Those figures point to more choice across the covered region than buyers had last year, but they do not mean every price band or neighborhood has the same selection.
Use inventory as a starting point, not a promise. A buyer looking for a specific school district, lot size, condition, or price range may still face limited options even when metro-level inventory is rising. Ask for a search that can be filtered to the areas and features that actually fit your plans. You can also review current listings through AMR’s homes-for-sale search. Search results can include listings AMR does not list or represent, so confirm the listing agent and representation details for any property you want to pursue.
2. Price data describes completed sales, not today’s asking prices
The October 2026 median sale price in the MIBOR Association report was $310,000, flat compared with October 2025 and down 2% from September. A median is the middle sale: half of the reported sales were higher and half were lower. It is not the value of a typical home in every Indianapolis neighborhood, and it is not a valuation for an individual property.
For buyers, the median can help frame a broad budget conversation, but it should not replace a property-level analysis. For sellers, the median is a context check rather than a pricing recommendation. A home’s condition, updates, lot, location, competing listings, and recent comparable sales matter more than applying a metro-wide percentage to an asking price. Ask for a comparative market analysis that separates genuinely comparable homes from the wider market.
3. Days on market helps reveal pace and leverage
Median days from listing to pending was 32 days in October 2026, up 23% year over year. This MIBOR measure tracks the time from listing to a pending contract for listings that went under contract during the period. It does not mean every home will sell in 32 days, and a pending contract is not the same as a closed transaction.
A longer market-wide timeline can give buyers more opportunities to compare homes, schedule inspections, and negotiate terms. It does not make every seller flexible: well-priced homes in strong locations can still attract attention quickly. Sellers should read days on market alongside showing activity, competing inventory, price position, and feedback. If a home receives little activity, the next step may be a better presentation, a pricing review, or a change in marketing strategy rather than waiting for a market average to work in its favor.
4. Pending contracts are an early signal, while closed sales look backward
Closed sales tell you what completed, but they are reported after the buyer and seller made their decisions. Pending contracts can provide an earlier view of demand. In October 2026, the MIBOR report recorded 2,672 new pending contracts, down 11% year over year. It also recorded 2,392 closed sales, down 15% year over year. MIBOR describes pending contracts as a strong predictor of sales trends several weeks ahead, while noting that not every pending contract becomes a closing.
Reading these measures together avoids a common mistake. A month with fewer closings does not automatically mean prices will fall, just as a month with more pending contracts does not guarantee a price increase. Buyers and sellers should watch the direction over several reporting periods and then compare the regional trend with the specific submarket they care about.
5. Seasonality changes the meaning of the same number
Real estate activity is seasonal. Listing volume, buyer traffic, offer competition, and closing counts can vary as families plan around school calendars, weather, holidays, and the normal annual cycle. An October result should be compared with both September and the same month in the prior year. That is why a year-over-year comparison can be more useful than a month-to-month headline alone, while a multi-month trend is often more reliable than either one in isolation.
The October report illustrates this distinction. New listings totaled 3,411, down 1% from September and 4% from October 2025. Closed sales totaled 2,392, down 11% from September and 15% from October 2025. Those results describe the activity recorded in that month; they do not forecast the next month or guarantee what will happen in a particular neighborhood.
How buyers can apply Indianapolis market data
- Translate the region into a search area. Start with the neighborhoods, commute, property type, and condition you actually want. Metro-wide supply does not tell you how many suitable homes are available to you.
- Use the data to set expectations. More inventory and a longer median timeline may create room for careful comparison, but a desirable home can still move quickly.
- Track total cost, not just price. Review taxes, insurance, financing, maintenance, and any improvements alongside the purchase price. AMR’s mortgage calculator can help with an initial affordability illustration; it is not a loan quote or approval.
- Ask about the property-level evidence. A local agent can compare recent sales, current competition, pending activity, and the home’s condition instead of relying on a single regional median.
How sellers can apply Indianapolis market data
- Price from comparable evidence. Use recent, similar closed sales and current competition as the foundation. The regional median is context, not a list price.
- Prepare for the buyer’s comparison set. Buyers have more ways to compare when inventory rises. Condition, photos, access, and accurate details can affect the response a listing receives.
- Watch the first weeks closely. Early showing volume, saves, questions, and feedback can reveal whether the market is responding to the price and presentation.
- Choose the right selling path. Some owners want a traditional listing and broad exposure; others value a direct conversation about selling without a conventional listing process. The right choice depends on timing, condition, certainty, and goals.
Contact AMR Real Estate for a local buyer or seller consultation
What the Indianapolis market data does not tell you
Market reports are useful because they create a common baseline, but they cannot answer every decision. They do not determine the value of one address, predict a guaranteed closing date, or show whether a particular offer will be accepted. They also do not replace an inspection, appraisal, lender guidance, legal advice, or a review of the property’s actual documents and condition.
For the most useful interpretation, combine dated public statistics with current property-level evidence and your own timeline. If you are buying or selling in Indianapolis, Fishers, or the surrounding Central Indiana market, an AMR Real Estate agent can help turn the numbers into a plan that fits your situation.
Sources and update note
This article was prepared and date-stamped November 19, 2026. The changing statistics are from the Indiana Association of REALTORS® MIBOR Association market dashboard and its October 2026 monthly report, last updated November 7, 2026. The dashboard covers the MIBOR Association’s 14-county area. Market conditions change, so recheck the source and request current local comparables before making a decision.
Categories
Recent Posts